The daily evaporation rate of Dewar is the most important technical parameter to evaluate the thermal insulation performance of Dewar, which can more intuitively reflect the cold preservation performance of Dewar. The national standard requires the upper limit of the static daily evaporation rate (working pressure 1.0-1.6Mpa) of the high-vacuum multi-layer adiabatic Dewar containing liquid nitrogen, see Table 1:
Table 1 Upper limit of static daily evaporation rate of high vacuum multilayer adiabatic Dewar
Nominal volume(L) | 10 | 25 | 50 | 100 | 150 | 175 | 200 | 300 | 450 |
Static daily evaporation rate(≤%/d) | 5.5 | 4.2 | 3.0 | 2.8 | 2.5 | 2.1 | 2.0 | 1.9 | 1.9 |
It is of great significance for the design and operation of Dewar to study the changes of temperature and pressure in Dewar, and to determine the daily evaporation rate of Dewar under working pressure through experiments. This paper discusses the effect of Dewar pressure on the daily evaporation rate, and quantitatively reveals the variation law of daily evaporation rate with pressure through experimental research.
1 Effect of pressure on daily evaporation rate
Generally speaking, the evaporation rate of a cryogenic container refers to the evaporation rate of an appropriate amount of cryogenic liquid contained in the container after reaching thermal equilibrium under standard conditions (0°C). It is generally calculated by , so it is also called the daily evaporation rate, that is, the ratio of the amount of liquid evaporated within 24 hours to the nominal volume of the container.
The influence of pressure on the daily evaporation rate is mainly reflected in the temperature difference and latent heat of vaporization. At steady state, the Dewar saturation pressure corresponds to the saturation temperature. The higher the saturation pressure, the higher the saturation temperature, the smaller the temperature difference with the environment, and the smaller the heat transfer. But at the same time, the latent heat of vaporization under the saturation pressure is also reduced, and the daily evaporation rate is the ratio of the heat transfer to the latent heat of vaporization. Therefore, it is necessary to conduct qualitative and quantitative analysis on the daily evaporation rate through experiments to provide a basis for practical engineering applications.
2. Experimental device and experimental process
2.1 Introduction to the experimental device
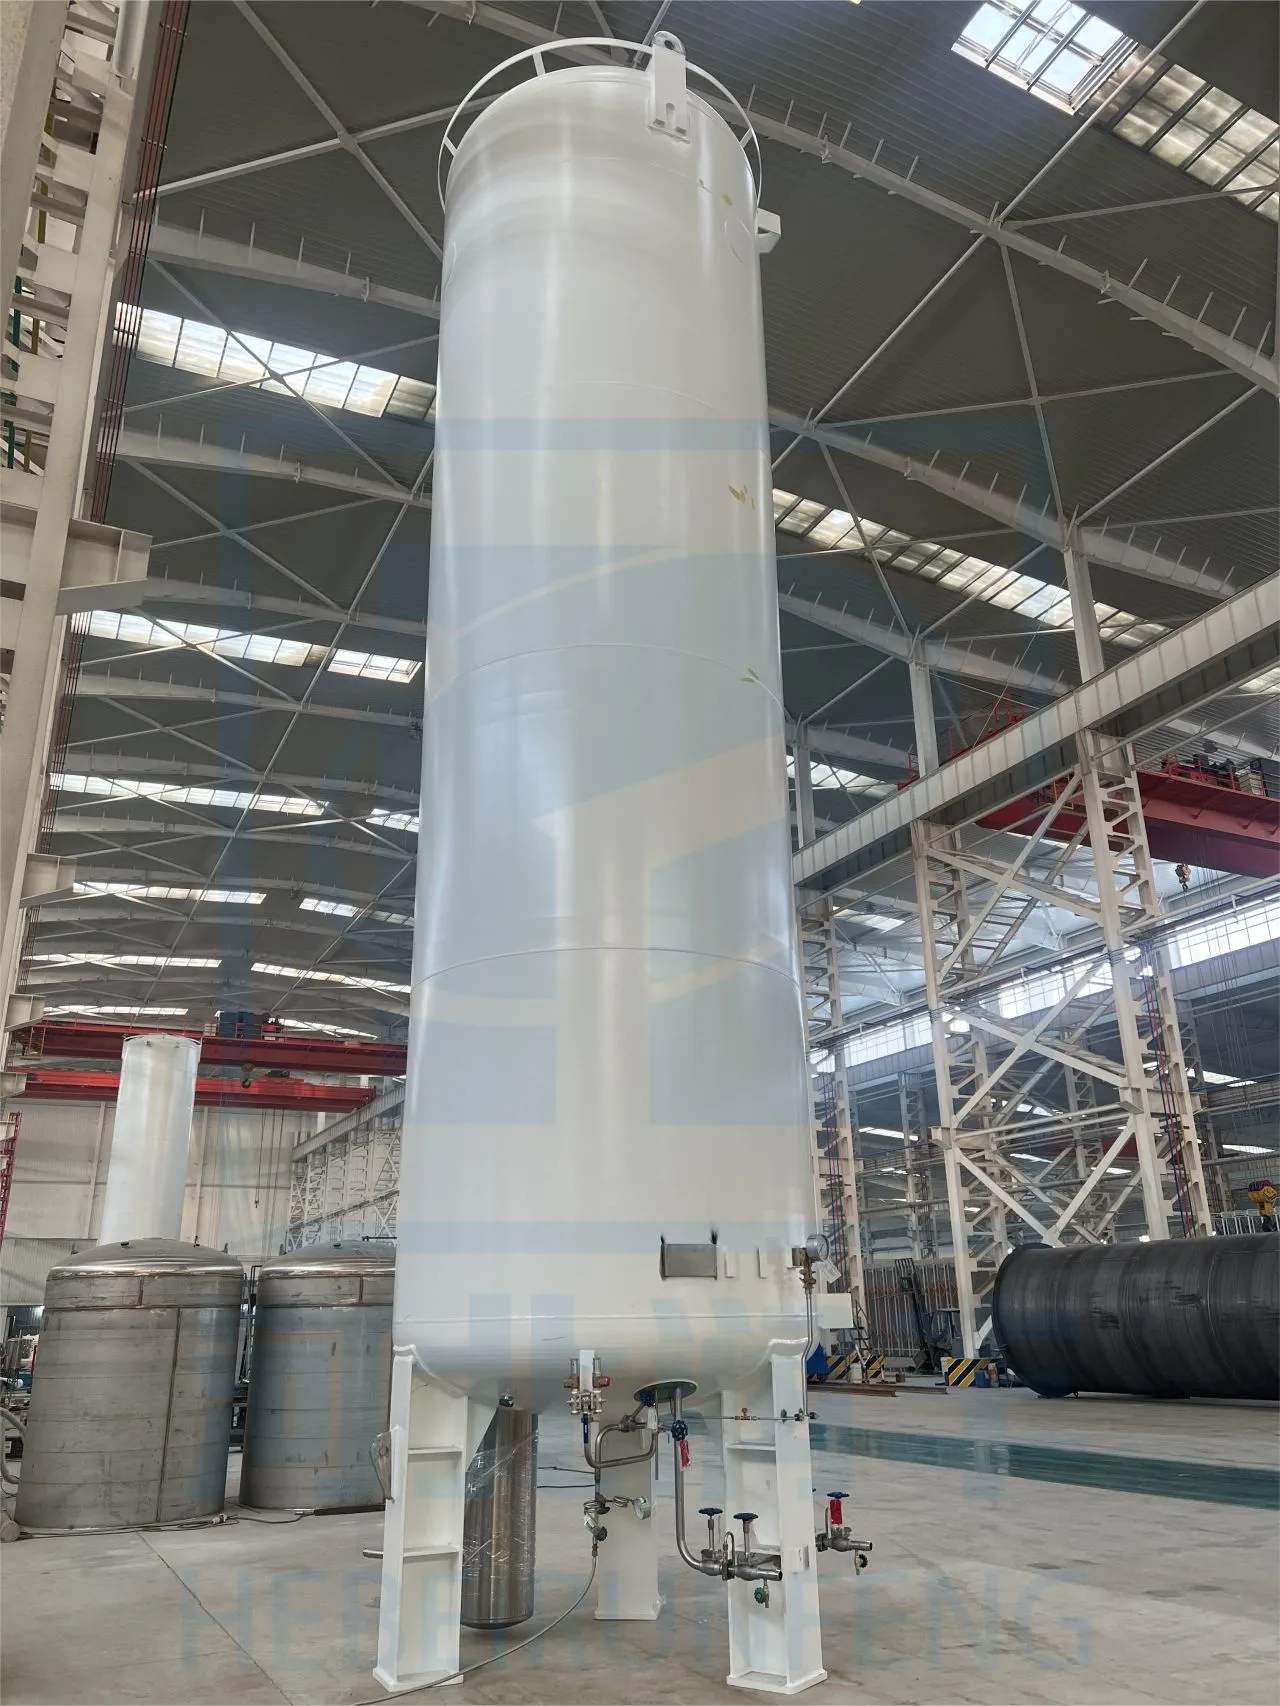
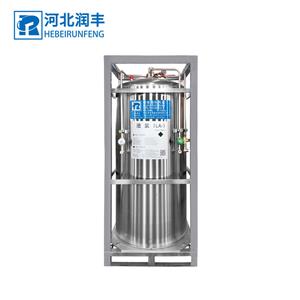
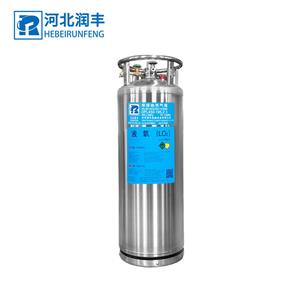
In this experiment, the mass flow meter was used to measure the mass flow of Dewar under five different pressures, and then the daily evaporation rate was calculated. The Dewar used in the experiment is a 175L low-temperature high-vacuum multi-layer adiabatic Dewar produced by a domestic manufacturer.
The Dewar supporting structure, the inner tank and the outer shell are all made of austenitic stainless steel, and the high-vacuum multi-layer heat insulation method is adopted, and the heat insulation materials are aluminum foil and glass fiber. The upper part of the Dewar is equipped with a liquid inlet and outlet valve, an air valve, a booster valve and a vent valve, and a self-booster and a vaporizer are installed inside. The geometric volume is 175L, the effective volume is 157L; the inner diameter of the liner is 450mm; the inner diameter of the shell is 500mm
The length of the hose between the pressure regulating valve and the flowmeter is 5 meters, which plays the role of vaporization and pressure reduction. In addition, it should be noted that the instrument used to measure the flow in the experiment is a mass flow meter of the model M-5SLPM-D produced by Alicat Scientific in the United States, with an accuracy of ±0.05SLPM (standard liter/minute), and can automatically The data is recorded, so the measurement requirements are fully met.
2.2 Measurement procedure
(1) The test medium is liquid nitrogen, and the filling rate is 90%. Open the Dewar vent valve, close other valves on the Dewar, and let stand for 48 hours;
(2) When the pressure inside the Dewar is stable at normal pressure, connect the hose to the vent valve and connect the mass flow meter. Pay attention to the tightness of the connection;
(3) After observing that the liquid nitrogen gas flow is stable, start recording data;
(4) The mass flowmeter records continuously for 48 hours;
(5) After the atmospheric pressure measurement, close the vent valve, disconnect the hose from the vent valve, and connect the pressure regulating valve to the vent valve;
(6) When the vent valve is closed, open the Dewar booster valve. When the Dewar gauge pressure shows around 0.3Mpa, close the booster valve;
(7) Adjust the pressure regulating valve, adjust the opening pressure of the pressure regulating valve to 0.23Mpa, and let it stand for 24 hours;
(8) After stabilization, connect the hose to the pressure regulating valve, connect the mass flow meter, and start recording data.
(9) After recording for 48 hours, close the vent valve, pressurize again, and repeat steps (6) to (8) to record the mass flow rate under the Dewar pressure of 0.54MPa, 1.08MPa, and 1.47Mpa
3. Experimental results and analysis
The five pressures in the experiment are: normal pressure, 0.23 MPa, 0.54 MPa, 1.08 Mpa and 1.47 Mpa. In order to make the experimental results more accurate, each pressure is recorded continuously for 48 hours
Under static and stable natural discharge conditions, the daily evaporation rate increases with the increase of Dewar pressure. This is exactly the opposite of what happens under pressure conditions. In simple terms, as the pressure increases, the corresponding saturation temperature increases, the temperature difference between the liquid in the Dewar and the environment decreases, and the heat transfer decreases. But at the same time, the latent heat of vaporization decreases with the increase of saturation temperature. This leads to a completely opposite conclusion to the pressure holding condition.
We can also draw an important conclusion: the impact of changes in the external environment on the daily evaporation rate is delayed with time. The ambient temperature reaches the minimum at around three o'clock in the morning, theoretically speaking, the evaporation rate should be the minimum at this time, and the evaporation rate in Figure 4 reaches the minimum value at seven o'clock in the morning; similarly, the ambient temperature is the highest at two o'clock in the afternoon, while in Figure 4 The evaporation rate reaches its highest value at ten o'clock in the evening. This is because the thermal insulation performance of the Dewar used in the experiment is very good, and it takes a period of time for the change of the ambient temperature to have a significant impact on the evaporation rate of the Dewar.